ADAM-2D
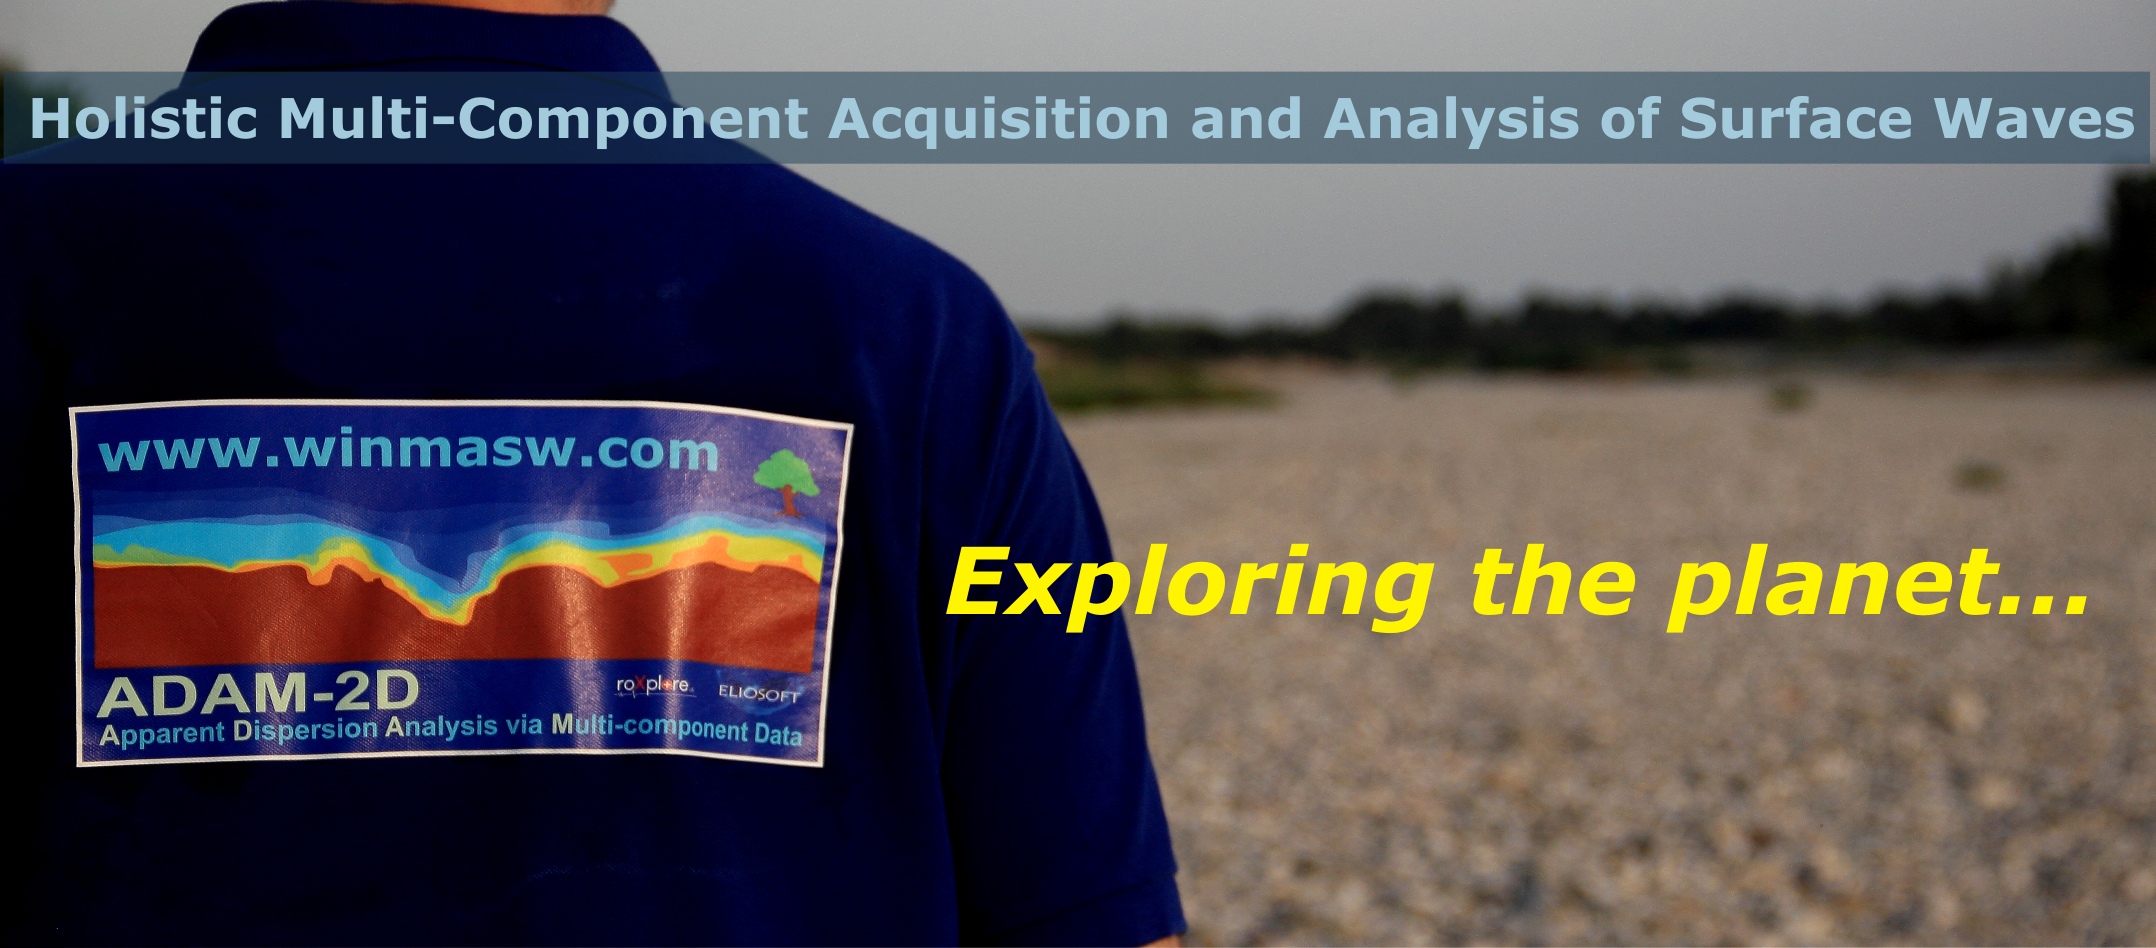
ADAM-2D: Apparent Dispersion Analysis of Multi-component data – 2D
Characterizing Large Areas (2D and 3D)
Thanks to synergies with European partner companies and our multi-component FVS (Full Velocity Spectrum – Dal Moro et al., 2014) approach, we can acquire and process multi-component data aimed at geotechnical characterization of large areas (2D and 3D).
With ADAM2D, you obtain the most reliable maps of shear-wave velocity distribution in the subsurface, in both 2D and 3D.
Our approach is based on the multi-component acquisition and analysis of surface waves, providing an improved understanding of shear strength in your geotechnical works, and potentially highlighting small-scale irregularities.
Key Benefits
-
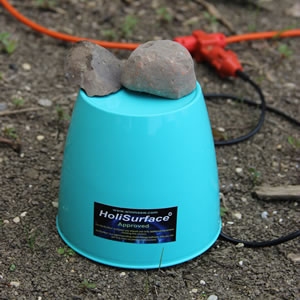
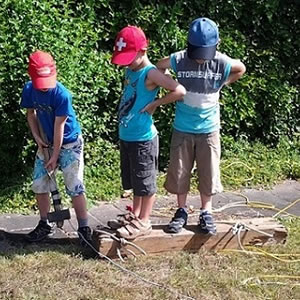
Acceptable field effort – compact equipment, applicable even in remote areas (1C, 2C, or 3C data acquisition)
-
Bi- or tri-component field data
-
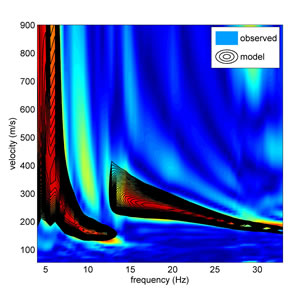
Robust joint analyses based on Full Velocity Spectra (FVS) inversion of multi-component data, jointly with the RPM (Rayleigh-wave Particle Motion) frequency-offset surface
-
No subjective/interpreted dispersion curve picking
-
High accuracy of results through bi- or tri-objective inversion
We can acquire and analyze the data or analyze your own data (acquired following our guidelines).
References
-
Optimizing the Exploration of Vast Areas via Multi-Component Surface-Wave Analysis, Dal Moro G. and Keller L., 2015, EAGE, Madrid, Spain – Introduces the methodology for exploring large areas using multi-component surface-wave analysis [Download Poster Version]
-
Multi-component Joint Analysis of Surface Waves, Dal Moro G., Moura R.M., Moustafa S., 2015, Journal of Applied Geophysics, 119, 128-138 – Presents the joint analysis of multi-component data based on FVS inversion
The complete procedure – joint analysis of the velocity spectra of the Z and R components together with the RPM frequency-offset surface – is described in: -
Efficient Joint Analysis of Surface Waves and Introduction to Vibration Analysis: Beyond the Clichés, Dal Moro G. , Springer, 2020
-
Improved Holistic Analysis of Rayleigh Waves for Single- and Multi-Offset Data, Dal Moro G., Moustafa S.R., Al-Arifi N., 2017, Pure and Applied Geophysics, DOI 10.1007/s00024-017-1694-8
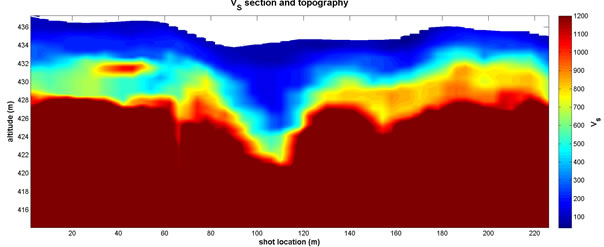
2D Vs section obtained by the joint analysis of Rayleigh and Love waves via joint Full Velocity Spectra (FVS) inversion performed in the framework of a Horizontal Directional Drilling project.
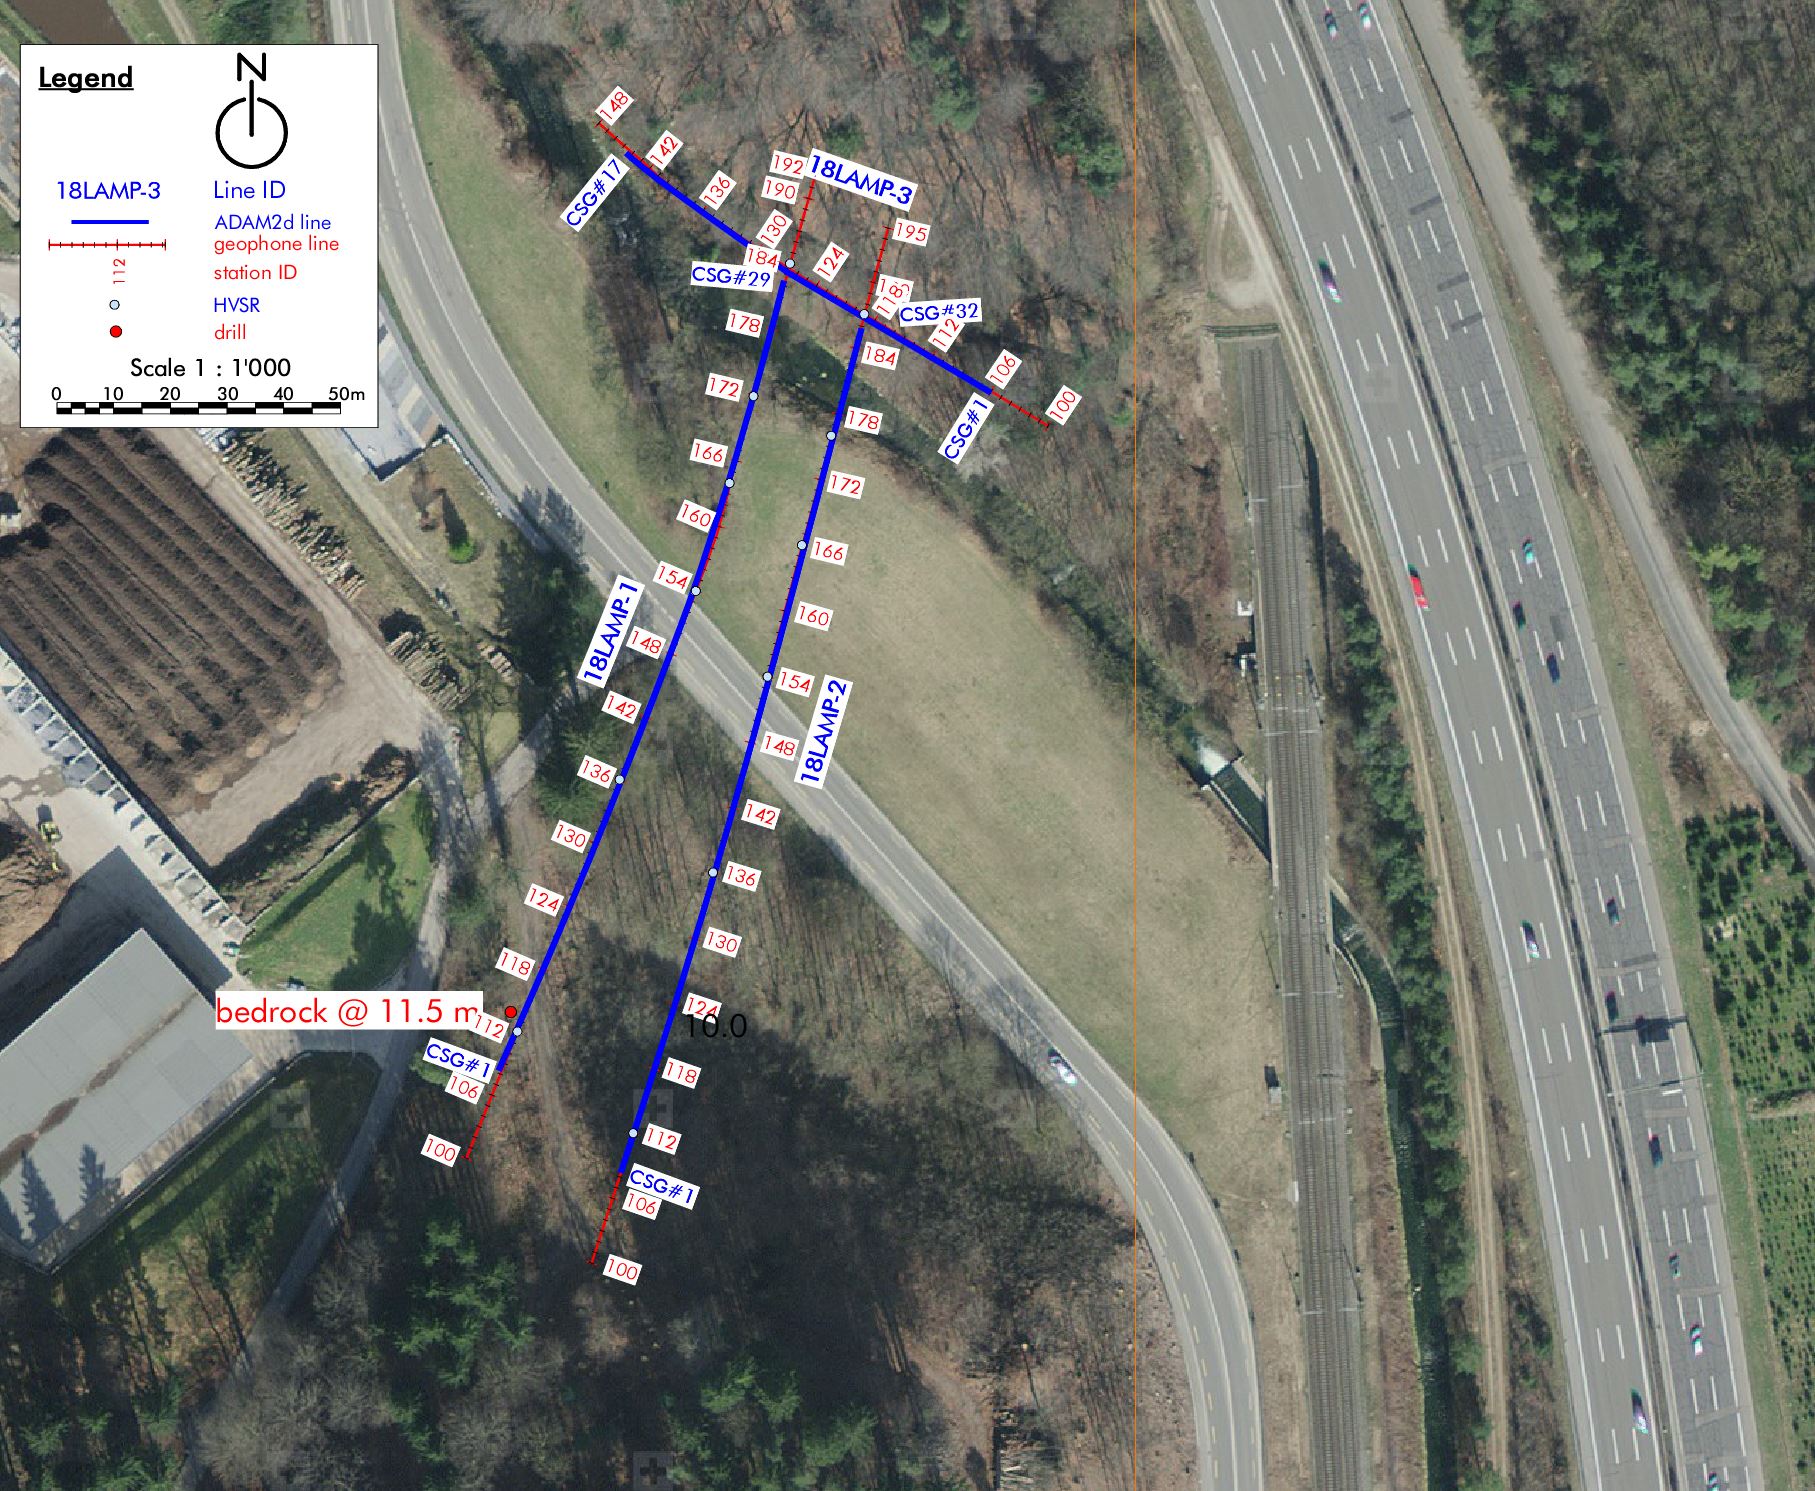
ADAM-2D survey in Switzerland
Detecting Cavities and Weak Zones
Identifying cavities or weak subsurface zones is a challenging task.
Traditional methods like refraction or simple dispersion analysis cannot reliably detect these features, both theory and practice confirm this.
Our approach
Using multi-component active seismic data, our ADAM service (Apparent Dispersion Analysis of Multi-Component Data) provides:
- A robust and detailed view of subsurface anomalies
-
Depth slices highlighting problematic zones (potential cavities or weak regions that traditional methods inevitably miss)
-
No reliance on simple shear-wave velocities or refraction travel times, which cannot be unambiguously identified or interpreted
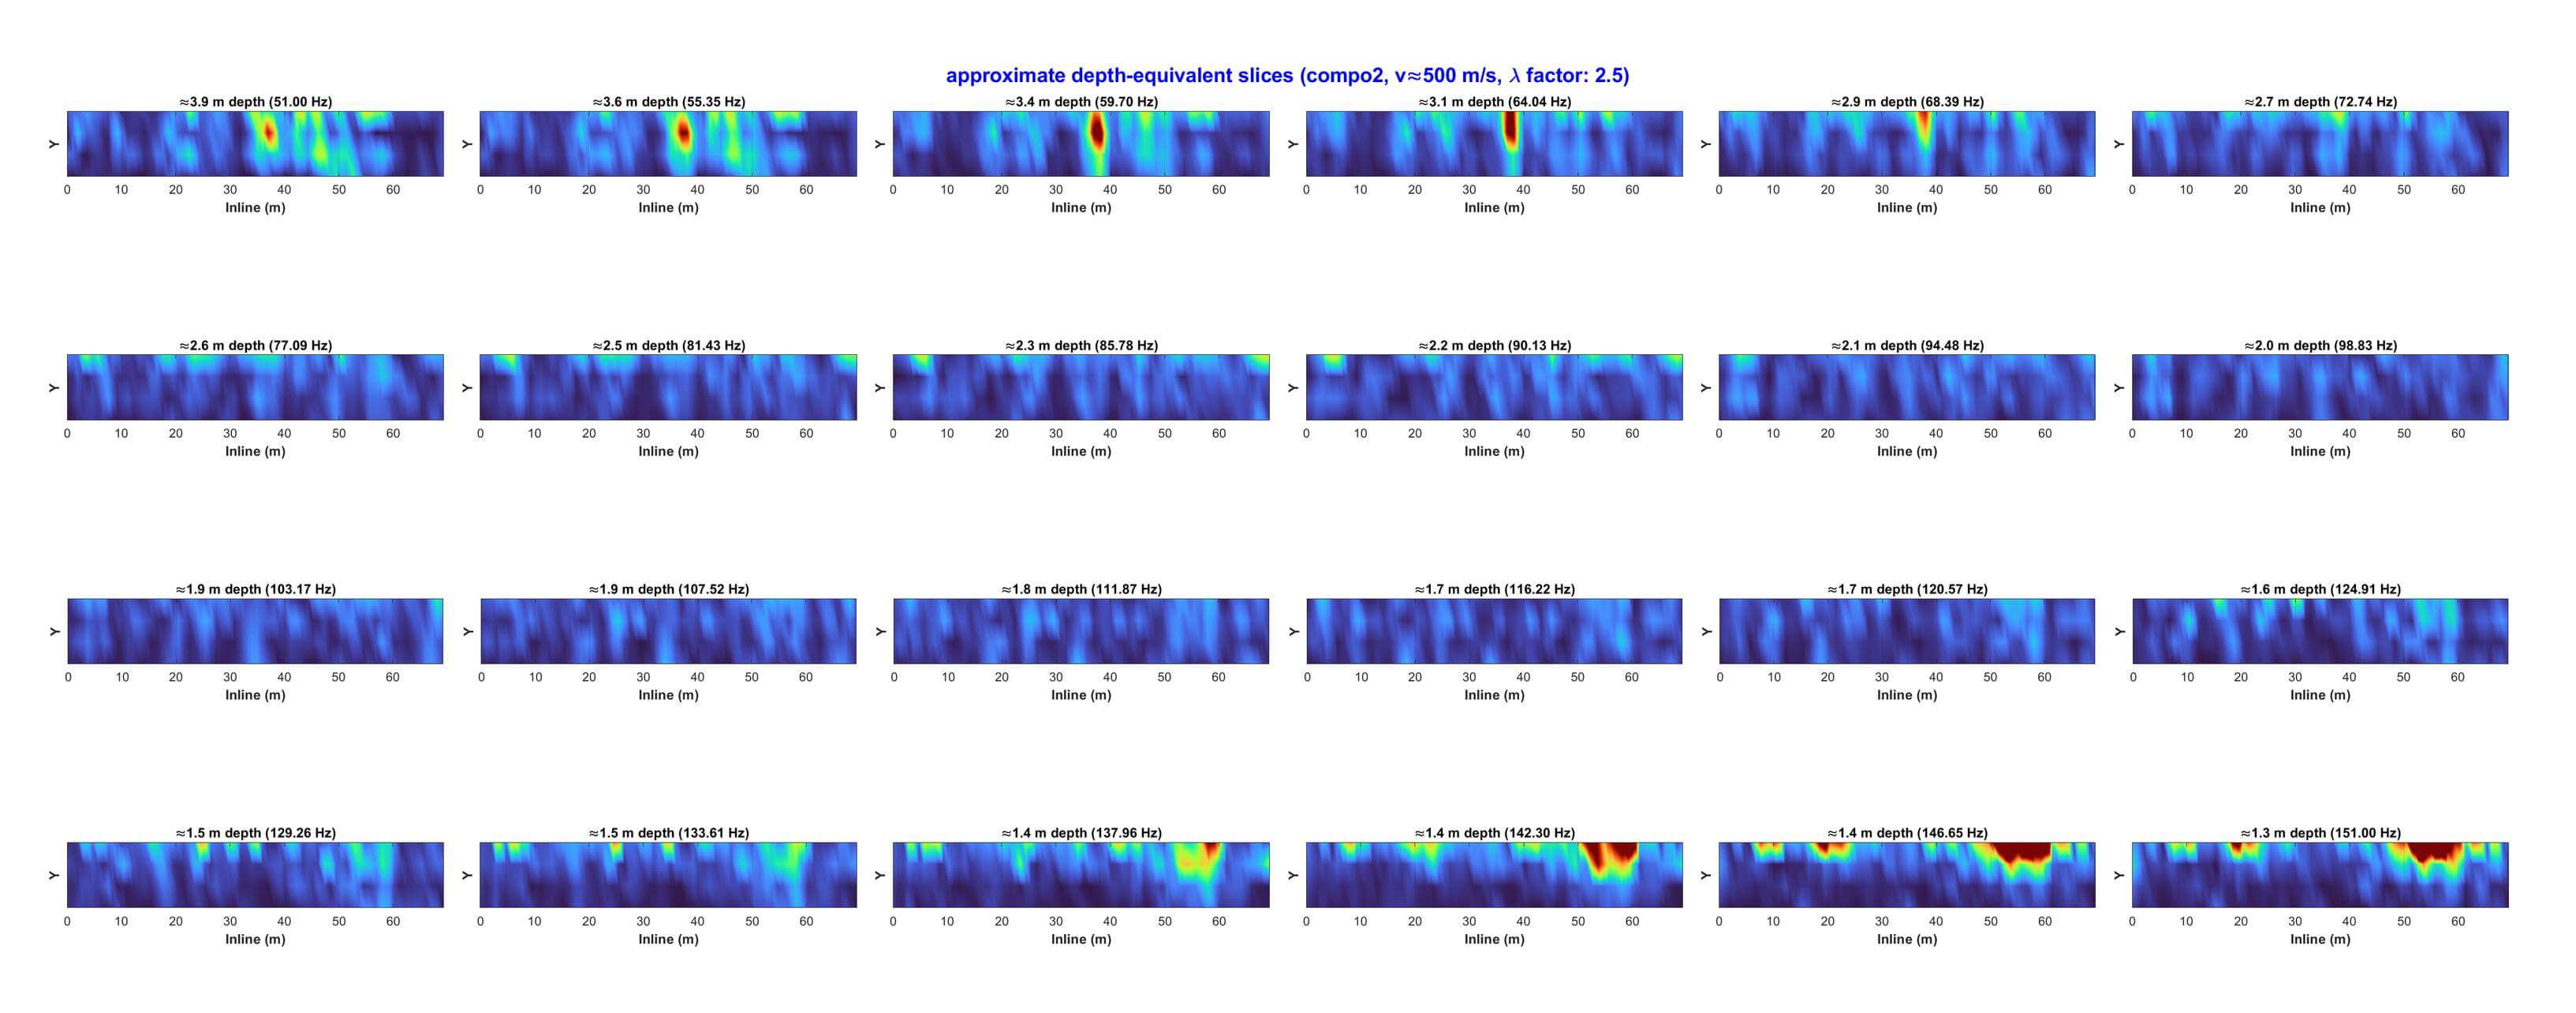
Above: depth slices showing problematic zones in red (potential cavities or weak areas) identified through our ADAM service using 3D active seismic data. In this case, there are 4 arrays (each consisting of Z and R components) arranged in parallel and towed along an asphalt road.