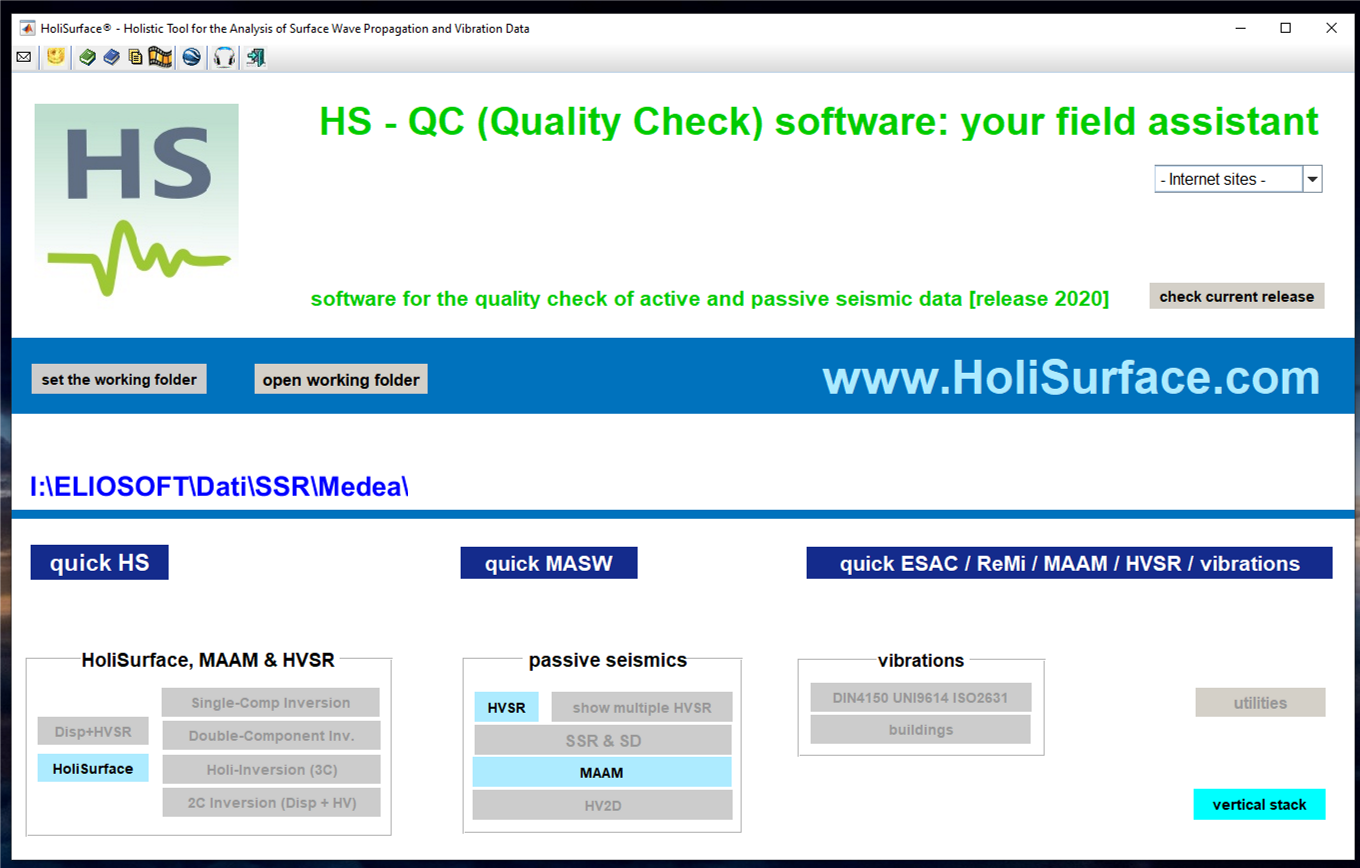
New software HS-QC [Quality Check of your seismic data]
![New software HS-QC [Quality Check of your seismic data]](/download/fotografie/news/143.jpg "New software HS-QC [Quality Check of your seismic data]")
HS-QC [Quality Check]: your field assistant
The new software to take with you on field to evaluate the quality of the data acquired:
- the quality check is done for any kind of active or passive data, for all possible techniques: MASW, HoliSurface®, HVSR, ESAC, ReMi, MAAM (Miniature Array Analysis of Microtremors), Spectral Ratios, vibrational analysis, etc.
- the HS-QC software works on 32 and 64bit computers
- activation with USB dongle
Most of the acquisition software applications of the seismographs available on the market lack of tools for the assessment of the data quality. Once your (active or passive) data has been acquired it is in fact impossible to evaluate the actual quality in a clear and "quantitative" way.
For this reason, in order to not bring home poor-quality data, a QC [Quality Check] version of our software applications has been implemented. The data quality can be evaluated for both active (MASW and HS) and passive (HVSR, ESAC, ReMi, MAAM, vibrational) data.
There are two families of panels:
1) quick analysis [dark blue buttons]: they allow a very quick and immediate evaluation of the data;
2) "full" analysis: they allow you to upload the data and perform broader and more in-depth analyses (these are simplified versions of the analyses possible with HoliSurface® and/or winMASW®).
For more details see the Appendix V of the draft (2021 edition) of the winMASW® manual available HERE.
The HS-QC software is available – at a small price – both for HoliSurface® / winMASW® users and for those who use other software applications.
Contact: winmasw@winmasw.com
What is HoliSurface®?
First of all, it must be highlighted that HS-QC is useful not only for the HS technique but for all the techniques (active and passive) related to the analysis of surface waves.
Here is a very brief summary of how to work with the HS technique:
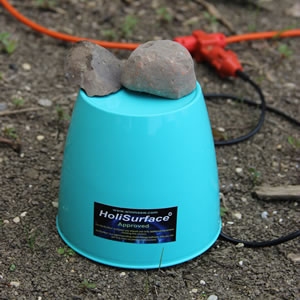
1) just deploy your 3-component (3C) geophone [the same you probably use for defining the HVSR] at a certain distance (offset) from the source. If you upload the photo of the array/site (taken for example with your smartphone) in HoliSurface® 2021, the software will read the position from the GPS data, thus reporting an image like the one shown below.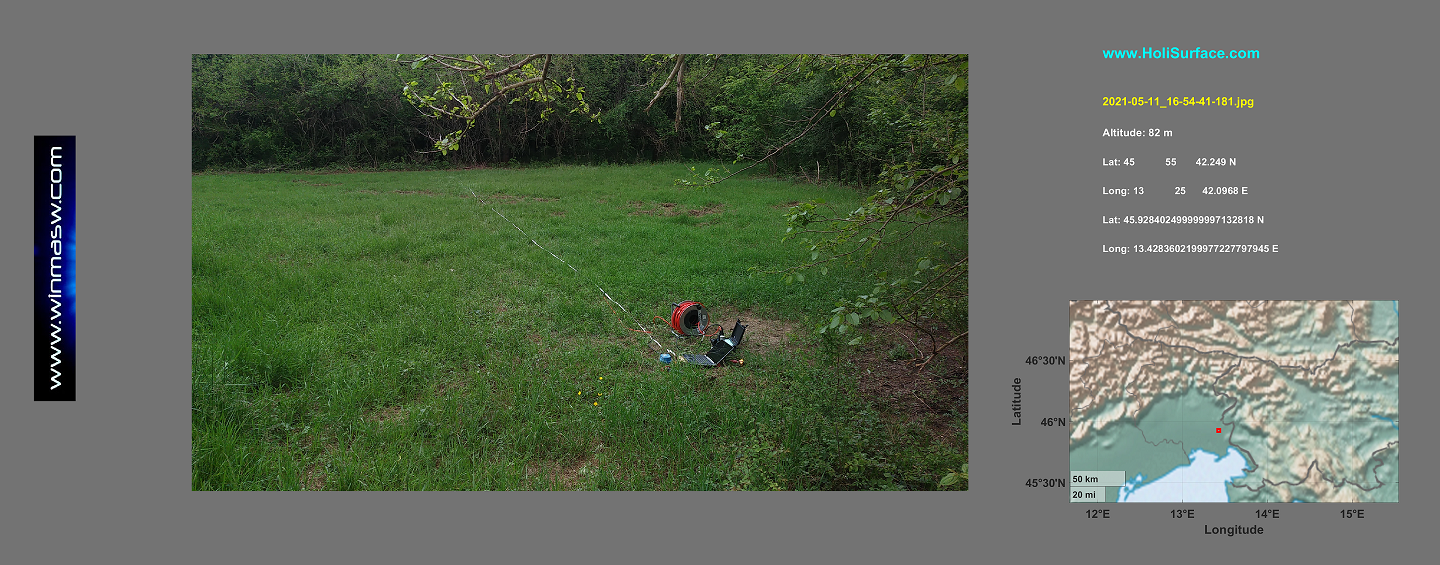
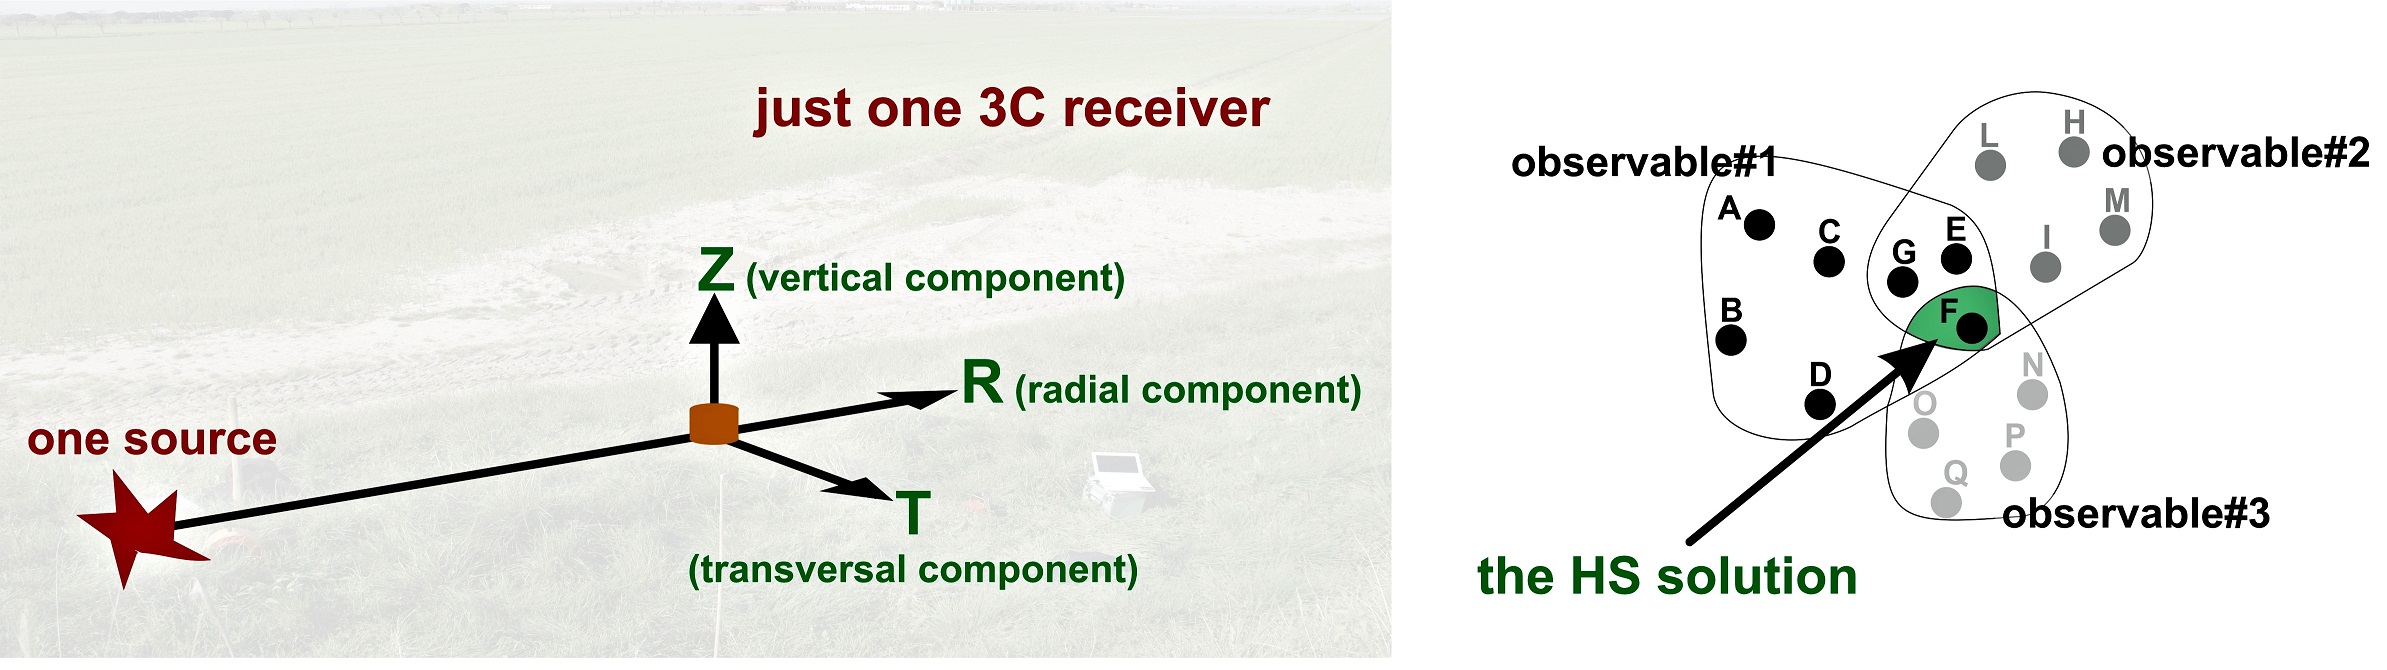
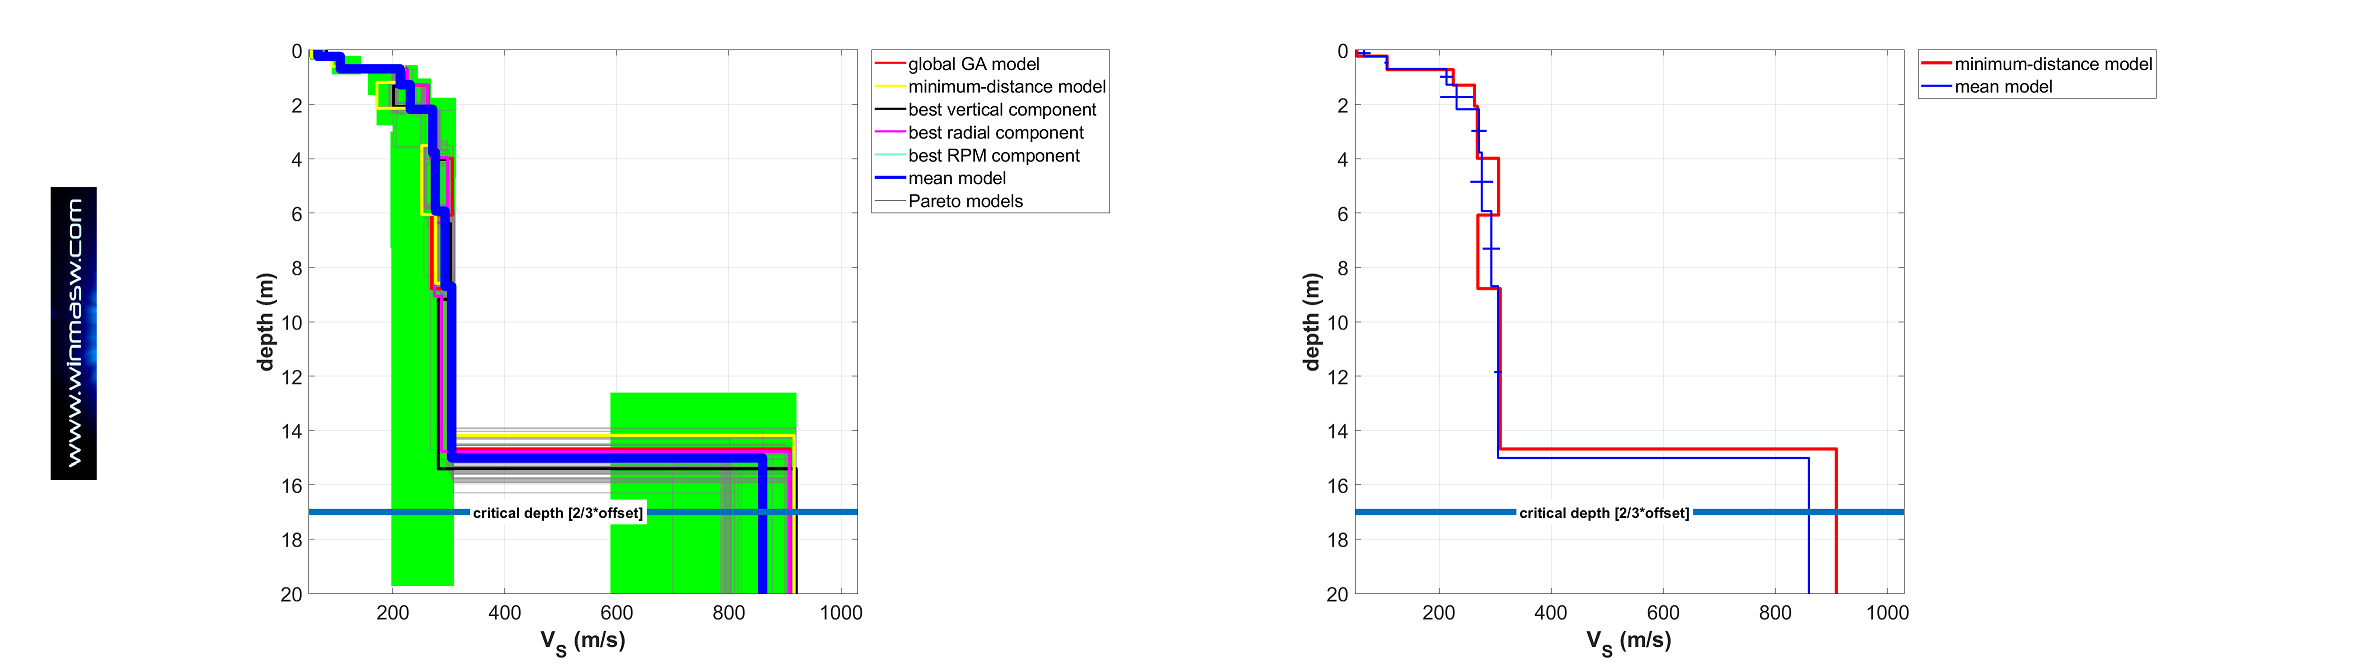
2) the acquisition of active data by means of a single 3C geophone allows you to jointly analyze up to 5 "objects" (observables), plus the HVSR curve as well. Thanks to the joint analysis of all these observables we will reduce all the ambiguities that will otherwise inevitably jeopardixze your analyses [standard MASW techniques - see conceptual scheme reported below and all articles and books reported in our HoliSurface® web page].
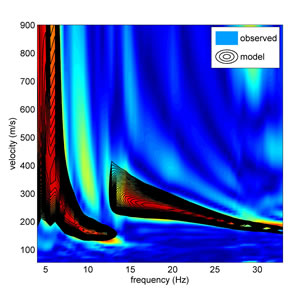
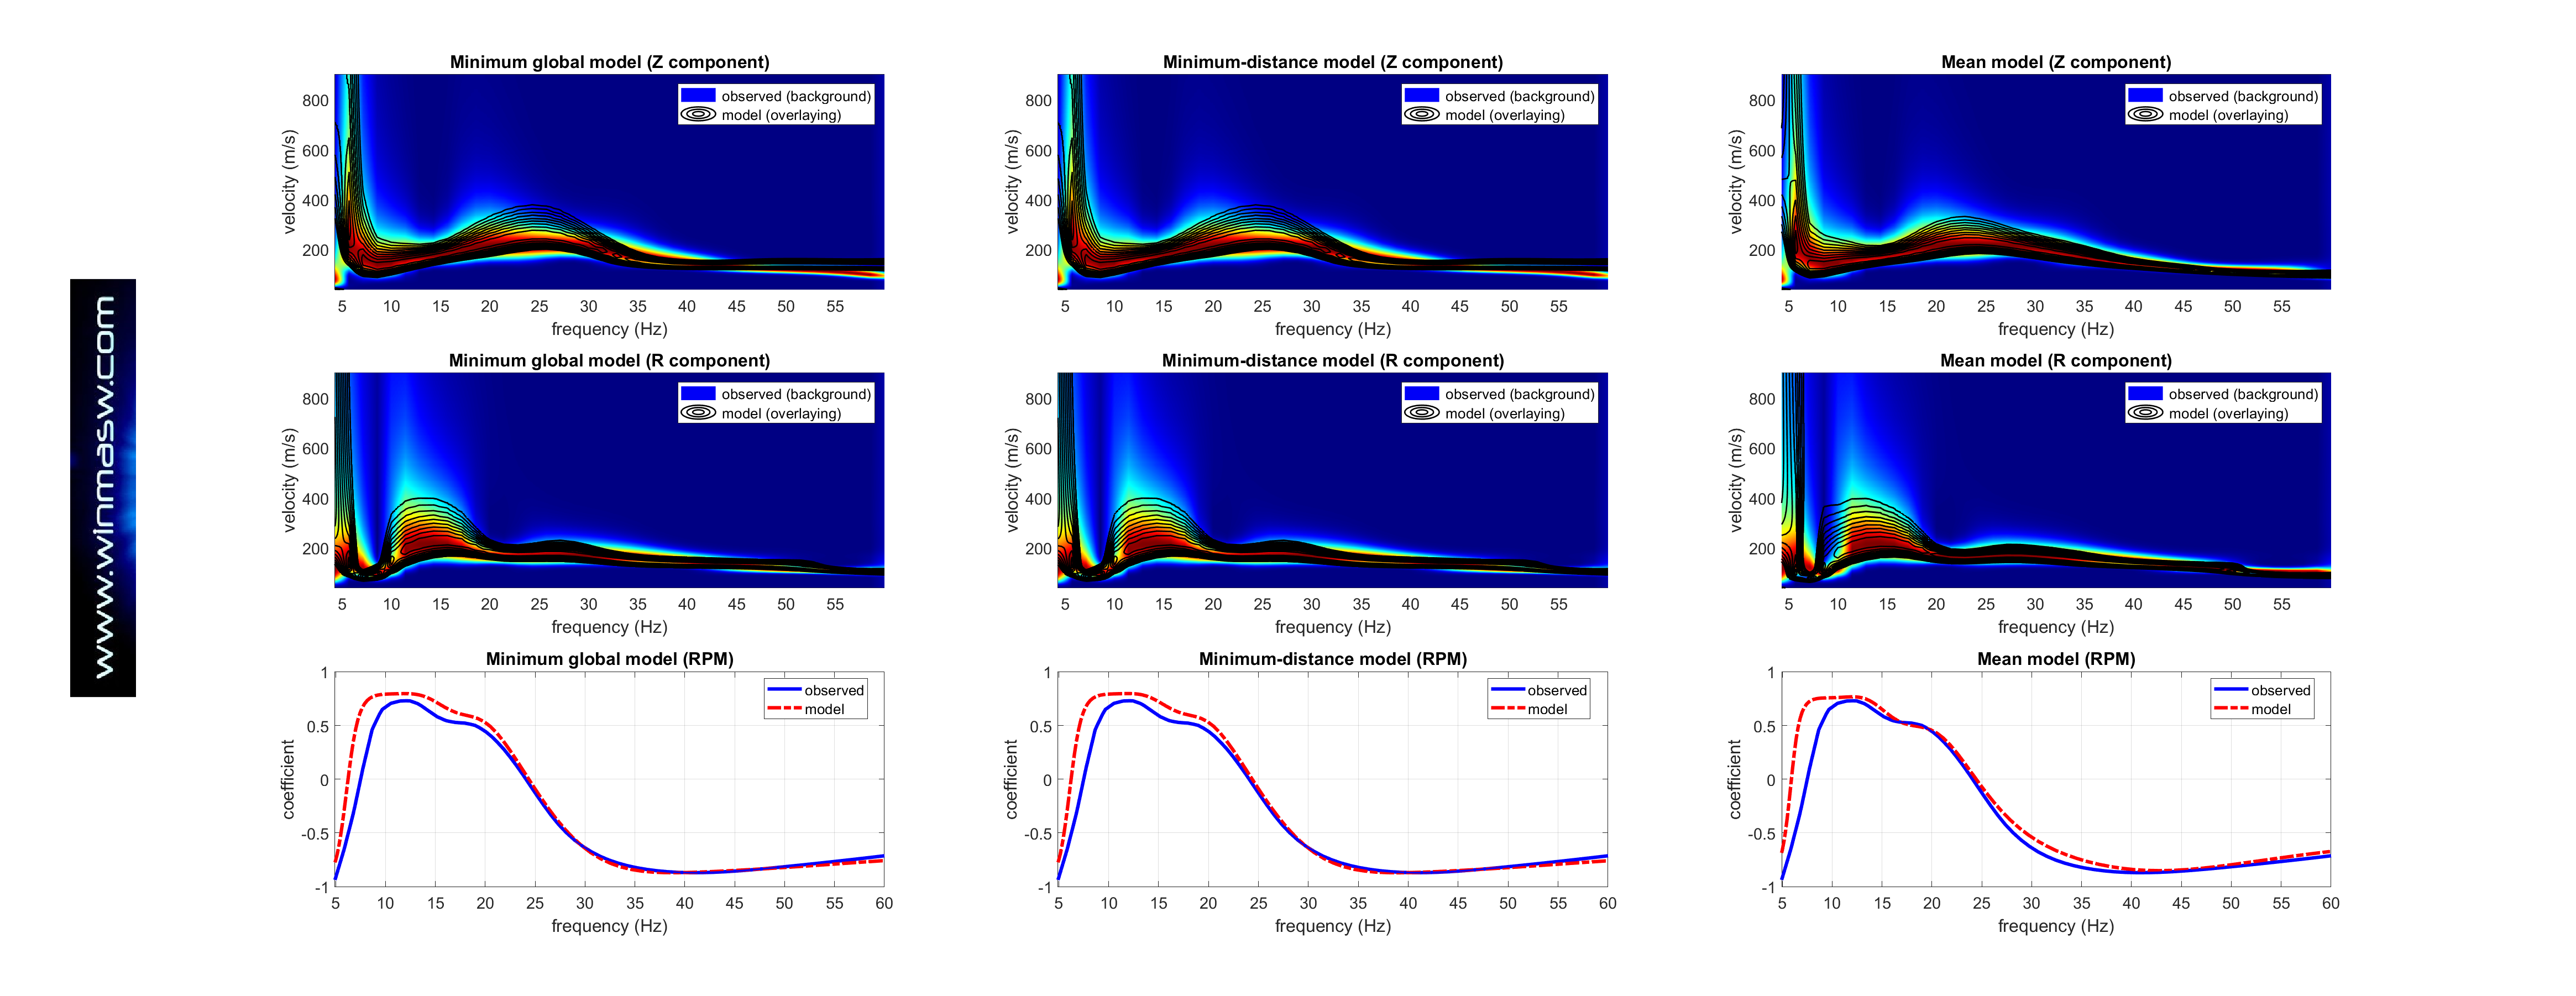
3) below the final result (shown the 3 best "global" models) of the joint inversion of the group velocity spectra of the Z and R components together with the RPM curve [see literature and HS manual]. Note the almost perfect consistency between the field data and the model(s). In this case the identification of the bedrock is perfectly consistent with all the data of the site and is also in agreememt with the HVSR curve, here not shown for the sake of brevity - see all the case studies available from the HoliSurface® web page].
- NEWS ARCHIVE
- share: